Difference between revisions of "Metrics"
| Line 1: | Line 1: | ||
__NOTOC__ | __NOTOC__ | ||
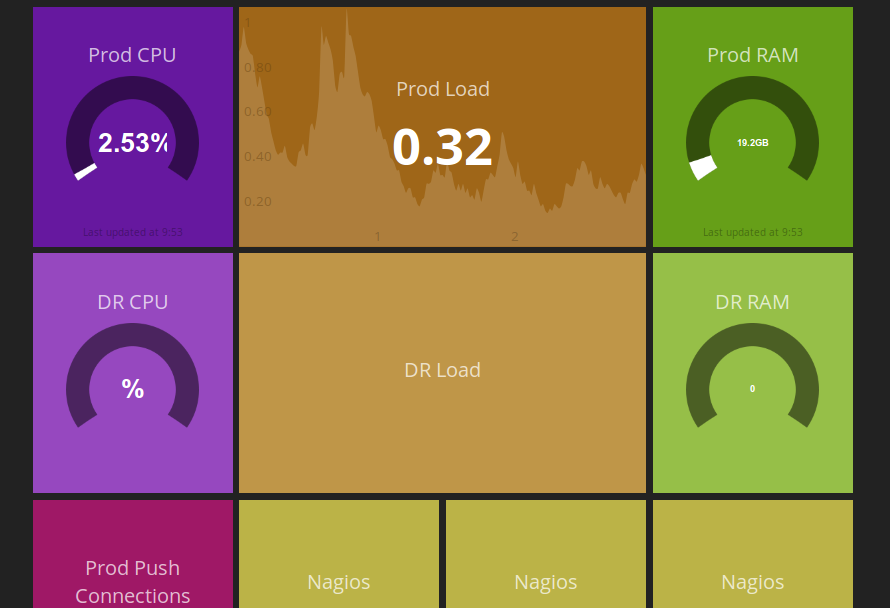
Here's how to set up a [http://dashing.io dashing.io] dashboard for your servers, using data from collectd, via graphite. | Here's how to set up a [http://dashing.io dashing.io] dashboard for your servers, using data from collectd, via graphite. | ||
| + | |||
| + | [[Image:dashing.png|320px|thumb|An example dashboard.]] | ||
== Setup instructions == | == Setup instructions == | ||
Latest revision as of 12:16, 21 August 2015
Here's how to set up a dashing.io dashboard for your servers, using data from collectd, via graphite.
Setup instructions
To get a dashing.io project running on 14.04:
sudo apt-get install ruby ruby-dev gem bundler nodejs build-essential
sudo gem install dashing rest-client activesupport
dashing new mydashboard
cd mydashboard
bundle
dashing start
Your new Dashing.io dashboard will be listening on port 3030 by default.
Running it as a daemon
Assuming we're on a 14.04 box, edit a new /etc/init/mydashboard.conf upstart file:
description "My dashing.io dashboard"
start on runlevel [2345]
stop on runlevel [!2345]

respawn
respawn limit 10 5
umask 022
expect fork
console log

pre-start script
    test -d /path/to/mydashboard || { stop; exit 0; }
end script
chdir /path/to/mydashboard
exec dashing start
And start the new service:
service tabdash start
Install collectd and graphite
We can configure collectd on all the boxes to beam data to graphite, and query the graphite data from the dashing.io dashboard. On all the boxes you care about, install collectd:
apt-get install collectd collectd-utils
On the graphite box, you'll need the graphite Django web application:
apt-get install graphite-carbon graphite-web apache2 libapache2-mod-wsgi
                     # or nginx uwsgi
Set up collectd
Enable the graphite plugin in /etc/collectd/collectd.conf with TCP, a prefix with a dot (which
means that graphite/carbon will put into a separate directory), and with all the things true:
LoadPlugin write_graphite

<Plugin write_graphite>
    <Node "graphing">
        Host "my.graphite.host"
        Port "2003"
        Protocol "tcp"
        LogSendErrors true
        Prefix "collectd."
        StoreRates true
        AlwaysAppendDS true
        EscapeCharacter "_"
    </Node>
</Plugin>
Set up graphite-web
On the graphite box, set up the Graphite virtual host configuration. Graphite is a Django application, so we need a web server that speaks WSGI. This is for Apache; you may want to edit it as required (and/or translate it into nginx+uwsgi):
cp /usr/share/graphite-web/apache2-graphite.conf /etc/apache2/sites-available/graphite-web.conf
a2ensite graphite-web
service apache2 reload
Then configure /etc/graphite/local_settings.py and add a unique key - this is used to hash user
passwords:
SECRET_KEY = 'big long string here' # pwgen -s 64 1
Then initialise the graphite-web SQLite database to get it started:
graphite-manage syncdb
chown _graphite:_graphite /var/lib/graphite/graphite.db
Set up graphite-carbon
Enable the Carbon cache, which is disabled by default:
echo 'CARBON_CACHE_ENABLED=true' > /etc/default/graphite-carbon
Set up a Carbon schema to record the incoming collectd data (using the Prefix set up in the collectd
write_graphite plugin). Edit the /etc/carbon/storage-schemas.conf file:
# Processed in order, so put this at the top, above the catch-all
[collectd]
pattern = ^collectd.*
retentions = 10s:1d,1m:7d,10m:1y
Restart it all:
service carbon-cache restart
